Overview
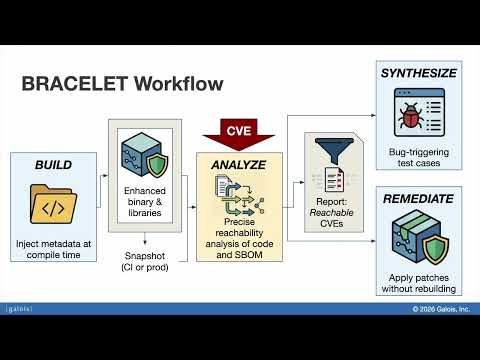
BRACELET (Binary Reachability Analysis with Compiler-Enhanced Lifting for Execution and Triage) is a set of tools for triaging vulnerabilities in the dependencies of a C or C++ application. BRACELET assists security engineers when triaging upstream vulnerability reports by automatically excluding vulnerabilities that are unreachable in their specific application context.
BRACELET currently supports C and C++ applications built with vcpkg.1 The first step to using BRACELET is to compile the application and its dependencies with the BRACELET toolchain. This toolchain embeds lightweight metadata into the final enhanced application binary. This metadata later feeds into BRACELET’s analyses.
When a CVE is discovered in a dependency, a developer or user encodes information about it (e.g., the affected package name, version, and function) into a simple, small JSON file. BRACELET consumes this information and analyzes the shipped enhanced binary to determine whether the vulnerability is reachable.
At a high level, BRACELET performs several tiers of analyses of escalating complexity and power:
- BRACELET first checks that the application was linked against the dependency version(s) that are affected by the vulnerability.
- Next, it performs a form of precise yet scalable static analysis (pointer
analysis) to construct a sound (i.e., overapproximate) and precise
callgraph. If the vulnerable function is not reachable from
main, the vulnerability is reported as unreachable. - If the vulnerability is deemed reachable, BRACELET supports synthesis of a test-case with Screach, a tool for binary-level symbolic execution.
The first two steps are highly automated. The third generally requires some manual intervention.
Notably, BRACELET’s triaging capabilities do not require access to source code. If an application was built the BRACELET toolchain, downstream users may use BRACELET to triage even a closed-source application.
The following diagram shows the BRACELET workflow in a bit more detail:
---
title: BRACELET Workflow
---
flowchart
direction TB
    classDef artifact fill:#d9d5d4;
    classDef braceletImpl fill:#c2e4ff;
    classDef upstream fill:#cea6f5
    subgraph Building
        vcpkg[VCPKG Application]
        vcpkg_port1[VCPKG Port 1]
        vcpkg_port2[VCPKG Port 2]
        bracelet_compiler[BRACELET Extended Compiler]
        app[Compiled Application]
        port_lib1[Port 1 Library Artifact]
        port_lib2[Port 2 Library Artifact]


        vcpkg --Package Metadata--> bracelet_compiler
        vcpkg_port1 --Port Metadata--> bracelet_compiler
        vcpkg_port2 --Port Metadata--> bracelet_compiler

        bracelet_compiler --> app
        bracelet_compiler --> port_lib1
        bracelet_compiler --> port_lib2

        class vcpkg,vcpkg_port1,vcpkg_port2,app,port_lib1,port_lib2 artifact;
        class bracelet_compiler braceletImpl;
    end
    app ----> running
    port_lib1 ----> running
    port_lib2 ----> running
    subgraph Snapshotting
        running[Running Program]
        snapshot_script[Snapshot Script]
        snapshot[Snapshot]

        running --> snapshot_script
        snapshot_script --> snapshot

        class snapshot_script braceletImpl;
        class running,snapshot artifact;
    end
    subgraph Reachability
        snapshot[Snapshot]
        vuln[Vulnerabilities JSON]
        bracelet-entry[BRACELET Entrypoint Script]
        reachability-results[Reachability Results JSON]
        snapshot --> bracelet-entry
        vuln --> bracelet-entry
        bracelet-entry --"Points-to analysis"--> reachability-results
        class snapshot,vuln,reachability-results artifact;
        class bracelet-entry-post,points-to,bracelet-entry,bracelet-edges,lightweight-analysis braceletImpl;
        class svf upstream;
    end
The BRACELET entrypoint script consumes a snapshot and vulnerability description and then orchestrates a reachability analysis. The script extracts metadata using bracelet-edges to determine the address of function entrypoints associated with each vulnerability. This matching checks for the existence of a target symbol and that it came from the vulnerable version range specified in the vulnerability.json. The script then constructs a callgraph either via a lightweight datalog analysis or SVF pointer analysis. If the target function is not in the callgraph the vulnerability is marked unreachable, otherwise the function is labeled as potentially reachable and a sample callgraph path is included as evidence.
Below is a detailed overview relating analysis steps to implementation details. For getting started read this chapter for installation instructions and the Example 1 walkthrough for a complete example.
Detailed Overview
The following diagram expands on the one shown above with additional details:
---
title: BRACELET Workflow
---
flowchart
direction TB
    classDef artifact fill:#d9d5d4;
    classDef braceletImpl fill:#c2e4ff;
    classDef upstream fill:#cea6f5
    subgraph Building
        vcpkg[VCPKG Application]
        vcpkg_port1[VCPKG Port 1]
        vcpkg_port2[VCPKG Port 2]
        bracelet_compiler[BRACELET Extended Compiler]
        app[Compiled Application]
        port_lib1[Port 1 Library Artifact]
        port_lib2[Port 2 Library Artifact]


        vcpkg --Package Metadata--> bracelet_compiler
        vcpkg_port1 --Port Metadata--> bracelet_compiler
        vcpkg_port2 --Port Metadata--> bracelet_compiler

        bracelet_compiler --> app
        bracelet_compiler --> port_lib1
        bracelet_compiler --> port_lib2

        class vcpkg,vcpkg_port1,vcpkg_port2,app,port_lib1,port_lib2 artifact;
        class bracelet_compiler braceletImpl;
    end
    Building --"Post-hoc Triage"--> Snapshotting
    subgraph Snapshotting
        direction LR
        shared_lib[Shared Libraries]
        dyn_lib[Dynamic Libraries]
        app2[Application]
        loader[Linker/Loader]
        running[Running Program]
        snapshot_script[Snapshot Script]
        gdb[GDB]
        coredump[Coredump]
        sysroot[Sysroot]

        app2 --> loader
        shared_lib --> loader
        loader --> running
        dyn_lib --"Linked at Runtime"--> running

        running --> snapshot_script
        snapshot_script --> gdb
        gdb --> coredump
        gdb --"Shared Libraries"--> sysroot

        class snapshot_script braceletImpl;
        class gdb,loader upstream;
        class app2,dyn_lib,shared_lib,running,coredump,sysroot artifact;
    end
    Snapshotting --"Reachability Analysis"--> Reachability
    subgraph Reachability
        direction LR
        snapshot[Snapshot]
        vuln[Vulnerabilities JSON]
        bracelet-entry[BRACELET Entrypoint Script]
        bracelet-entry-post[BRACELET Entrypoint Post Processing]
        svf[SVF]
        bracelet-edges[BRACELET Edges]
        lightweight-analysis[Lightweight Datalog Analysis]
        points-to[BRACELET Points-To]
        reachability-results[Reachability Results JSON]
        snapshot --> bracelet-entry
        vuln --> bracelet-entry
        bracelet-entry --> bracelet-edges
        bracelet-edges --"Datalog Facts"--> lightweight-analysis
        lightweight-analysis --"Callgraph"--> bracelet-entry-post
        bracelet-entry --> points-to
        points-to --"C Representation of Edges"--> svf
        svf --Callgraph--> bracelet-entry-post
        bracelet-entry-post --> reachability-results
        class snapshot,vuln,reachability-results artifact;
        class bracelet-entry-post,points-to,bracelet-entry,bracelet-edges,lightweight-analysis braceletImpl;
        class svf upstream;
    end
And the compilation workflow:
---
title: BRACELET Compilation Workflow
---
flowchart LR
    file[Source File]
    clang[Clang]
    comp_wrap[BRACELET Compiler Wrapper]
    reachability_pass[Reachability Pass]
    annotated_binary[Annotated Object File]

    reachability_pass --"Invoked by"--> comp_wrap
    comp_wrap --"Appends required flags"---> clang
    file --> comp_wrap
    clang --> annotated_binary

    classDef artifact fill:#d9d5d4;
    classDef braceletImpl fill:#c2e4ff;

    class comp_wrap,reachability_pass braceletImpl;
    class file,annotated_binary artifact;
The above graph shows how a single source file is compiled with points-to metadata. The BRACELET toolchain compiler wrapper generated from build_base/compiler_wrapper.sh
consumes a source file and produces an object file containing metadata in the GR_graph_edges and GR_graph_debug sections. The rest of the compilation process after
The reachability LLVM pass located in
src/BRACELETReachability traverses an LLVM module and creates globals in several sections that store tuples described in the metadata chapter.
YouTube Video
This material is based upon work supported by the Defense Advanced Research Projects Agency under Contract No. HR001124C0488.
Any opinions, findings and conclusions or recommendations expressed in this material are those of the author(s) and do not necessarily reflect the views of the Defense Advanced Research Projects Agency or the U.S. Government.
Distribution Statement A. Approved for public release: distribution is unlimited.
-
BRACELET is not fundamentally tied to vcpkg, and with a bit of work could be used with other build systems. ↩
Getting Started
Installing
The BRACELET toolchain provides a nix-shell that builds a modified clang, LLVM pass, compiler wrapper, and VCPKG toolchain.
The shell sets VCPKG_OVERLAY_TRIPLETS so that the bracelet triplet is available by default
First you need to install nix
The build depends on nix-ccache to enable fast recompilation of LLVM. This can be setup by exposing the ccache dir:
sudo mkdir -m0770 -p /nix/var/cache/ccache
sudo chown --reference=/nix/store /nix/var/cache/ccache
The shared cache is also reused when a Nix build is interrupted and restarted. The first LLVM build still takes substantially longer than later builds.
The directory needs to be added to the extra sandbox in the nix.conf (typically $HOME/.config/nix/nix.conf):
extra-sandbox-paths = /nix/var/cache/ccache
Unfortunately, the build of BRACELET is not currently completely isolated so you will have to add the following setting as well:
sandbox = relaxed
Finally, if you receive a warning:
warning: ignoring the user-specified setting 'extra-sandbox-paths', because it is a restricted setting and you are not a trusted user
When you execute nix commands (e.g. nix-build/nix-shell) you will need to add the following:
trusted-users = <username>
to /etc/nix/nix.conf (for a multi-user install).
To apply this setting you will need to restart the nix-daemon:
sudo systemctl daemon-reload
sudo systemctl restart nix-daemon
From the repository root, enter the development environment:
nix-shell
This builds LLVM and BRACELET, creates and activates a Python virtual environment, and sets the toolchain environment:
VCPKG_OVERLAY_TRIPLETSmakes the BRACELET vcpkg triplets available.BRACELET_TOOLCHAIN_FILEselects the BRACELET compiler wrappers.VCPKG_TOOLCHAIN_FILEselects vcpkg’s CMake integration.BRACELET_INCLUDE_DIRprovides the snapshot API headers.SVF_PATH,SVF_CLANG_PATH, andSVF_LLVM_PATHconfigure optional SVF analysis.
Inside the environment you should be able to execute bracelet-cc.sh
Building With Upstream LLVM
The pass can also be compiled and loaded with an upstream LLVM 20 installation:
env LLVM_CONFIG=<path to upstream llvm-config> uv run --dev meson setup build-upstream \
  -Dbracelet_llvm_extensions=false \
  -Dclang-dir=<path to upstream clang bin directory>
uv run --dev meson compile -C build-upstream bracelet_reachability
This mode omits the fork-specific metadata that places DW_TAG_label entries
at callsite addresses. It is useful for CI, but its output is not suitable for
BRACELET callsite analysis. CI also compiles a sample program and verifies that
the pass emits decodable GR_graph_edges and GR_graph_debug sections.
This build does not exercise SVF. The separate bracelet-points-to tool invokes
an SVF installation or container at runtime.
Building a Project
The Example 1 walkthrough describes how to build a project and run the reachability analysis.
Example 1 Walkthrough
Example 1 is a CLI file processor in
examples/example1. It uses libmagic to detect
a file’s MIME type and dispatches through an indirect call to a text, XML, or
gzip handler.
The example demonstrates how to build an application with BRACELET metadata, capture its runtime dependencies, and classify reported vulnerabilities using a reconstructed callgraph.
Build
Enter the development environment described in Getting Started, then configure the project:
cd examples/example1

cmake -S . -B build -G Ninja \
  -DVCPKG_TARGET_TRIPLET=x64-linux-braceletnodbg \
  -DVCPKG_CHAINLOAD_TOOLCHAIN_FILE="$BRACELET_TOOLCHAIN_FILE" \
  -DCMAKE_TOOLCHAIN_FILE="$VCPKG_TOOLCHAIN_FILE"

cmake --build build --parallel
ctest --test-dir build --output-on-failure
The x64-linux-braceletnodbg triplet builds the application and its pinned
vcpkg dependencies with BRACELET metadata, but omits optional names and source
locations used to make low-level analysis output easier to read.
Run the gzip input:
./build/compressor --file ./example-input/input.txt.gz
The output should include:
Retrieved mimetype: application/gzip
Header listed timestamp: 0
Finished inflate call current total: 43
Capture a snapshot
The snapshot records the process core and copies its executable and loaded shared libraries into a sysroot:
python -m bracelet_scripts.snapshot_handler snapshot -- \
  ./build/compressor --file ./example-input/input.txt.gz
The destination directory must not already exist. Snapshotting requires a native x86-64 Linux process. Docker Desktop with Rosetta produces an incompatible ARM64 translator core.
If GDB reports a ptrace permission error, temporarily allow same-user attachment:
echo 0 | sudo tee /proc/sys/kernel/yama/ptrace_scope
Run reachability analysis
Generate the callgraph and classify the vulnerability reports:
python -m bracelet_scripts.entrypoint \
  --bracelet-edges bracelet-edges \
  snapshot \
  --vuln-json vulnerabilities.json \
  --run-cg-filter \
  --save-callgraph callgraph.csv | tee result.json
The complete Bracelet result is printed and saved to result.json.
The reports cover:
| Vulnerability | Package | Expected result |
|---|---|---|
| CVE-2022-37434 | zlib | Potentially reachable |
| CVE-2022-48554 | libmagic | Potentially reachable |
| CVE-2025-27113 | libxml2 | Unreachable |
The zlib path reaches inflateGetHeader through ZlibCallback::processFile.
The libmagic path reaches file_copystr through MIME detection. The libxml2
pattern-matching issue is unreachable because the application does not call
the affected API.
The optional SVF analysis can be enabled with:
python -m bracelet_scripts.entrypoint \
  --bracelet-edges bracelet-edges \
  snapshot \
  --vuln-json vulnerabilities.json \
  --run-cg-filter \
  --svf-pointer-analysis \
  --bracelet-points-to bracelet-points-to \
  --svf-llvm "$SVF_LLVM_PATH" \
  --svf-clang "$SVF_CLANG_PATH" \
  --svf-path "$SVF_PATH"
SVF is unlikely to terminate on this example in a reasonable time.
GitLab pipeline
The pipeline is defined in examples/example1/ci/gitlab-ci.yml and included
by the repository’s root pipeline. It has three jobs:
example1-buildbuilds the application and runs all sample-input tests.example1-snapshotcaptures the gzip execution.example1-analysiscreates the callgraph and prints the classifications.
The analysis job retains result.json and callgraph.csv as artifacts.
Metadata Specification
The BRACELET toolchain embeds metadata that enables post-hoc reachability analysis of symbols with respect to SBOM-like information.
BRACELET metadata is stored in three places, the two sections: GR_graph_debug and GR_graph_edges and in DWARF sections via DW_TAG_label’s of callsites.
GR_graph_edges
The primary data-structures for BRACELET are stored in the GR_graph_edges section.
The rough C types for the graph data stored in this section are below:
struct GraphData {
  GraphHeader H;
  // This points at a ZSTD-compressed blob in the debug data section.
  DebugData* DD;
  void* Symbols[num_symbols];
  // Inline z-std compressed
  FunctionData[num_functions];
};


struct GraphHeader {
  std::array<uint32_t, 2> magic_number;
  uint32_t function_data_compressed_size;
  uint32_t debug_data_compressed_size;
  uint32_t num_symbols
  uint32_t string_blob_length;
  uint32_t has_debug_locals;
  uint32_t has_debug_locals;
  uint32_t total_num_locals;
  uint32_t num_functions;
  uint32_t function_array_length;
};
The graph data is placed directly in GR_graph_edges. Abstractly, this data represents a stream of edges per function.
Importantly, the Symbols table associates a virtual address to a symbol index. The FunctionData for a given function stores the symbol index of that function. The linker updates the addresses in the symbol table via the relocations for the GR_graph_edges section, allowing BRACELET to find which function address metadata is associated with post-link.
IMPORTANT note: A current limitation of this strategy is that the symbol table will always point to an updated address for a symbol even if the symbol was weak for our given module and not linked. This in practice means, that for weak symbols, metadata for all definitions (even unlinked definitions) are preserved and equivalent. We lose track of which weak symbol is invoked. Currently, based on how bracelet-edges works this will result in the last metadata record observed “winning” as it is written last.
FunctionData is a stream of uint32_t which have been compressed with
streamvbyte (NOT streamvbyte’s delta encoding). That streamvbyte output is then
compressed with zstd.
FunctionData = zstd_compress(streamvbyte_encode(array_of_integers));

// The contents of the FunctionData array is a stream, for each function:
template<typename EdgeKind>
struct Edges {
  uint32_t num_edges;
  struct {
    // For each edge kind, we do a fresh zig-zag delta encoding, and store those
    // encoded deltas in the to/from fields. A _single_ running delta is shared
    // among _both_ to and from.
    DeltaEncodedZigZag to, from;
    if(EdgeKind == IndexedEdge) uint32_t index;
  } [num_edges];
};
struct FunctionData {
  uint32_t symbol_index; // The symbol index of this function
  uint32_t sbom_component_index; // The index into the debug table of the string representing the CycloneDX component this function came from.
  uint32_t sbom_version_index; // The index into the debug table of the string representing the version of the component this symbol came from.
  uint32_t num_locals;
  // Alloca locals come first in the ordering. Any locals with an index under
  // this threshold are allocas.
  uint32_t num_allocas;
  Edges<SingletonEdge> assign;
  // ...
  Edges<IndexedEdge> call;
  // ...
};
The first uint32_t is the index for the function into the symbol table. This index is used by the reader to retrieve the function address of this data.
The second uint32_t is the number of locals (and the third is allocas). These sizes are used to find the function data’s local names in the debug data (that is string names of local variables stored in the debug_data string table described in the graph debug data section).
Finally, for each edge type there is a stream of tuples representing edges between nodes. Specifically there are two kinds of edges Singleton edges which are of the form (dst, src), and Indexed edges which are of the form (dst, src, idx). The src and dst are nodes which identify either a symbol or a local which is part of a symbol (that is a symbol + an index to some local).
Edge Types
Singleton: Assign
Format: (dest, source), represents the assignment of some source node (a local) to the dest node (another local).
Singleton: Load
Format: (into, addr), represents a load from addr (a local holding the addr) into the into (a local).
Indexed: Call
Format: (callsite, callee, nargs), represents a call from a callsite (a local representing the LLVM value of the call) to the callee (a local or a direct call to a symbol node). nargs is the number of arguments to the call.
Singleton: Return
Format: (func, value), represents a call from a function func (symbol) into value (a local representing the return).
Indexed: ArgumentDefinition
Format (value, func, arg_no), represents the formal parameter of the function func (a symbol) that is assigned into the value value (a local). The arg_no is the argument number of this local.
Indexed: ArgumentSupply
Format (callsite, value, arg_no), represents the actual parameter passed at the callsite (a local representing the call) that is assigned the value value (a local). The arg_no is the argument number of this actual parameter.
Singleton: DlsymPagePointer
Format (dlsym_output, page_ptr), used to track the address of page_ptr (symbol) dynamically holding the values returned by this dlsym callsite represented by the local for that callsite (dlsym_output). These edges allow us to (in a snapshot) retrieve the set of addresses the return of dlsym could point to.
GR_graph_debug
The graph debug section is a zlib compressed null-delimited string table. There are two purposes of this table:
- To store the names of locals if debug info is not disabled (
no-bracelet-include-debug-data) - To store the strings for SBOM information: that is the component and version that sourced this symbol (used for the identity of the symbol when analyzing VEX records).
Specifically:
struct DebugData {
  // Sequence of null terminated strings
  char* string_blob;
  // Indices of local names for each function in order. FunctionData uses num_locals to find the set of locals for each function by traversing debug data in order.
  Optional<Array<uint32_t>> local_indices;
};
The debug data interns strings for all strings used within function data (local names and SBOM information). The indices of each local are stored in order in a streamv encoded array of integers. Each function’s locals are stored in a slice num_locals large in this array.
Note: the value of has_debug_locals in the graph header is used to determine if the local_indices field is present.
DWARF Labels
When constructing a callgraph, BRACELET must relate an address of a call to the node for the callsite in the graph. This relationship allows various pointer analyses to translate from pointer relationships between locals/nodes to actual call targets.
This information is stored as special debug labels attached to the call. Specifically, BRACELET generates a DW_TAG_label with the name “BRACELET_LAB_X” where X is the local index of the call. The parent suprocedure of the DWARF label DIE is used to find the containing function address for the node (func_addr, local). This setup allows BRACELET to generate a table from callsite address to node without generating debug information which is slow to print.
Previously, BRACELET used the source location from debug information (in the debug table) for the callsite to find corresponding addresses to that source location in DWARF. This solution was slow and also selects all addresses associated with an address range rather than the actual address of the call.
Dlsym tables
As mentioned when describing Dlsym edges, dlsym tables hold the pointers returned by a given dlsym callsite. Each dlsym callsite gets a linked-list of pages containing pointers.
struct DlsymPage {
  // The next page or null, the runtime will allocate more pages as needed
  void* next;
  // the number of pointers on this page
  uint64_t count;
  void* pointers[MAX_POINTERS_PER_PAGE];
}
The page contains the set of pointers returned from a given callsite. The BRACELET runtime allocates these pages on the fly during execution.
Points-to Analyses
BRACELET’s reachability analysis filters vulnerabilities by checking whether a
vulnerable function appears in an over-approximated whole-program callgraph
rooted at the application entrypoint. Building that callgraph requires
resolving indirect calls (function pointers, vtables, callbacks supplied to
APIs like pthread_create or qsort), which in turn requires a points-to
analysis over the linked program.
This chapter describes the current implementation in src/PointsTo, which
constructs an SVF-compatible C representation of the BRACELET edge metadata
and delegates the actual fixed-point computation to SVF’s Andersen’s analysis.
Background
The original BRACELET design called for a custom field-sensitive points-to
analysis encoded as a Dyck-reachability problem over the embedded edge
graph. A prototype was implemented along those lines, but did not scale to
mid-sized targets, and bringing it to parity with state-of-the-art tooling
would have required substantial additional engineering and research. We kept
the existing metadata embedding scheme (GR_graph_edges / GR_graph_debug —
see metadata) but replaced the custom solver with a generic
interface to off-the-shelf analyses, currently SVF.
Approach
The PointsTo binary reads BRACELET metadata from a linked program (or a
coredump plus sysroot), emits a C program that reifies the recorded
points-to/dataflow edges, links it with the SVF clang/llvm-link toolchain, and
runs the SVF implementation of Andersen’s points-to analysis on the resulting
bitcode. The bracelet fork of SVF has additional support for writing the
final callgraph and points-to relations as CSV files that are consumed by
downstream tools to build a callgraph and perform reachability analysis.
---
title: PointsTo data flow
---
flowchart LR
    classDef artifact fill:#d9d5d4;
    classDef braceletImpl fill:#c2e4ff;
    classDef upstream fill:#cea6f5;

    binary[Linked binary or coredump]
    metadata[GR_graph_edges + GR_graph_debug]
    emit[EmitC pass]
    cfiles[Generated C: prelude.h, globals.c, <sym>.c, Makefile]
    bc[linked.bc]
    svf[SVF Andersen]
    cg[cg.csv]
    pts[pts.csv]

    binary --> metadata
    metadata --> emit
    emit --> cfiles
    cfiles --> bc
    bc --> svf
    svf --> cg
    svf --> pts

    class binary,metadata,cfiles,bc,cg,pts artifact;
    class emit braceletImpl;
    class svf upstream;
The key idea is that the BRACELET edge metadata is already a graph encoding of the program’s pointer flow at a granularity sufficient for points-to analysis. By emitting a small C program in which each metadata edge becomes a straight-line C statement guarded by a non-deterministic choice, we let SVF treat our graph as if it were the source program: SVF’s standard inclusion constraints, indirect-call resolution, and external-API models all apply unchanged.
Worked example
Consider a fragment of cJSON’s parse_object:
static cJSON_bool parse_object(cJSON * const item, parse_buffer * const input_buffer) {
    cJSON *head = NULL;
    cJSON *current_item = NULL;
    if (input_buffer->depth >= CJSON_NESTING_LIMIT)
        return false;
    input_buffer->depth++;
    /* ... parse an object ... */
    G_parse_string(item, input_buffer);
    G_parse_value(item, input_buffer);
    /* ... */
}
The BRACELET pass records, for each LLVM value of pointer type, a node, and for each pointer-relevant operation (assignment, load, store, call, return, argument passing, dlsym site) an edge. Emission turns those nodes and edges into a representative C function:
void *G_parse_object(void *arg0, void *arg1) {
  void *L_0x1a;       // local nodes (allocas, SSA pointers, ...)
  void *L_0x55;
  void *L_0x3e;
  void *L__input_buffer;
  void *L_call64;
  void *L__item;
  while (__nondeterministic_choice()) {
    NONDET L__item = arg0;            // ArgumentDefinition
    NONDET L__input_buffer = arg1;    // ArgumentDefinition
    NONDET DEREF(L_0x1a) = L_0x1a;    // Store
    NONDET DEREF(L__item) = L_0x1a;
    NONDET L_call64 =
        G_parse_string(L_0x1a, L__input_buffer);   // Call
    NONDET L_0x3e =
        G_parse_value(L_0x1a, L__input_buffer);
    NONDET L_0x1a =
        ((function_0)(DEREF(L__input_buffer)))();  // indirect Call
    NONDET L_0x55 = G_cJSON_Delete(L_0x1a);
  }
  return (void *)0x0;
}
Three properties matter:
- Every pointer node is typed
void *(Tin the templates). Field sensitivity, struct layout, and arithmetic are deliberately discarded — the analysis is field-insensitive by design. - Each edge is wrapped in a
NONDET(if (__nondeterministic_choice())) inside an outerwhile (__nondeterministic_choice())loop. This makes the emitted code order-insensitive: SVF cannot rely on any particular execution order, so the resulting points-to relation is a sound over-approximation of every possible interleaving of the recorded edges. allocas becomemalloc(__nondeterministic_choice()), and globals get an initializer that does the same.__nondeterministic_choiceis left undefined so SVF treats it as returning an arbitrary value.
Edge to C mapping
The full template is in src/PointsTo/templates/c.txt. Locals are rendered as
local_<idx>_NODE_<func_addr> and symbols as NODE_<addr>; here we use
shorthand. T is void *. Each row below is wrapped in NONDET inside the
outer while (__nondeterministic_choice()) body of the emitting function.
| Edge | Operands | Emitted C |
|---|---|---|
Assign | (dest, source) | dest = source; |
Load | (into, addr) | into = *((T*)addr); |
Store | (addr, value) | *((T*)addr) = value; |
Call | (callsite, callee, nargs) | callsite = callee(call_arg_<callsite>_0, ..., call_arg_<callsite>_{nargs-1}); (callees that are local nodes are first cast to T(*)(T,...,T)) |
Return | (func, value) | return value; (emitted inside the function whose symbol is func) |
ArgumentDefinition | (value, func, arg_no) | value = arg<arg_no>; (emitted in the callee) |
ArgumentSupply | (callsite, value, arg_no) | call_arg_<callsite>_<arg_no> = value; (emitted in the caller, before the matching Call) |
DlsymPagePointer | (dlsym_output, page_ptr) | For each runtime pointer p recorded in the dlsym page chain rooted at page_ptr, emit dlsym_output = NODE_p; |
In addition, for each function:
- The first
num_allocaslocals are initialized withlocal_i = malloc(__nondeterministic_choice());at function entry (outside thewhileloop), modelling stack allocations as fresh heap objects. - For each
Calledge, a temporaryT call_arg_<callsite>_<i>is declared per argument so thatArgumentSupplyandCallcan refer to them symbolically without ordering constraints between supplier and call.
Globals
Globals are declared in globals.c and initialized in
bracelet_global_init_<name> to a fresh malloc. SVF’s main entry,
synthesized by the SVF Makefile, is unimportant for callgraph purposes; what
matters is that the analysis sees the global as a possible target for any
edge whose endpoint is that symbol.
Node states
While walking edges, the emitter classifies each non-local symbol node into
one of three states (PointsTo.cpp::NodeState):
NodeStateUndefined— bottom of the lattice; symbol seen but role not yet determined.NodeStateGlobalData— a non-function global; emitted asextern T <sym>;.NodeStateFunction(nargs)— emitted asextern T <sym>(T arg0, ..., T arg{nargs-1});.nargsis the maximum of (a) the largestarg_noplus one observed inArgumentDefinitionedges in that function and (b) thenargsseen on anyCalledge whose callee is that symbol.
Store edges whose addr is a global force the global into
NodeStateGlobalData. Mismatched assignments to the function lattice cell
(differing arities for the same symbol) are reported as errors.
External overrides (prelude)
src/PointsTo/templates/prelude.txt defines DEF_OVERRIDE /
DEF_OVERRIDE_INLINE macros that supply hand-written models for libc, libstdc++,
and pthreads functions whose pointer behaviour SVF needs to see explicitly. A
symbol referenced in the metadata that matches a name in override_nargs
(populated by the prelude) is redirected via
#define <sym> OVERRIDE(<name>), so calls in the emitted C end up dispatched
to the prelude’s model rather than to an opaque extern.
Three flavours of override appear in the prelude:
- Allocators (
malloc,calloc,realloc,posix_memalign,mmap,_Znwm,fopen, …): forward to the real libc allocator with__nondeterministic_choice()for size arguments. SVF’sextapi.bcrecognizes the underlying allocator names so the returned pointer is treated as a fresh allocation site. - Empty models (
free,strlen,strcmp,pthread_mutex_lock,clock_gettime, …): take their arguments and returnNULL. Used when the function neither reads nor produces pointers relevant to points-to. - Conservative models (
_Rb_tree_*and friends): mix all arguments via a chain of stores/loads through a fresh allocation, used when we want SVF to assume the function may shuffle pointers among its arguments.
A few overrides encode application-specific dataflow that SVF would not otherwise see, most importantly:
pthread_create(thread_out, attr, start_routine, arg)callsstart_routine(arg)directly inside the model, so the start routine’s callgraph edge frompthread_create’s caller is preserved.qsort/qsort_rinvoke their comparator on the array base pointer.fopencookieplumbs the cookie functions struct into a fakeFILE.
Conservative mode
If --conservative is passed, every symbol declared (in the prelude or by
the metadata as a function) but never defined by the metadata receives a
synthesized body from templates/conservative.txt. The body mixes all
arguments via stores/loads through a fresh allocation, so missing code is
modelled as “may read, write, and return any pointer reachable from the
arguments”. Without --conservative, missing functions remain extern and
SVF treats them with its default external-API behaviour. The list of
emitted-but-undefined functions is always written to missing.txt in the
work directory regardless of mode.
SVF invocation
The emitted directory contains:
prelude.h        # extern declarations + override models
globals.c        # global definitions and per-global initializers
0x<addr>.c       # one file per defined function
missing.txt      # symbols referenced but not defined by metadata
Makefile         # builds linked.bc with SVF's clang
The Svf helper in PointsTo.cpp runs:
make linked.bc
bracelet -ander -ind-call-limit=4294967295 \
    -extapi=$SVF/lib/extapi.bc \
    [-bracelet-pointsto=pts.csv] \
    -bracelet-callgraph=cg.csv \
    linked.bc
If SVF is not installed locally (no $SVF_DIR directory present), the
helper falls back to invoking it via podman or docker against the
gitlab.ebossproject.com:5005/galois/svf/svf:galois-3.1 image, with the work
directory bind-mounted in.
cg.csv records resolved indirect-call targets and is consumed by the
reachability pipeline. pts.csv (only emitted with --save-pts) is parsed
back into a PointsToEdges set — a flat_hash_set<pair<Node, Node>> —
when computePointsTo is used in-process; entries are of the form
<src_addr>\t<src_local|->\t<dst_addr>\t<dst_local|->.
Validating against runtime traces
checkPointsToAgainstTrace cross-checks the static points-to result against
dynamic traces collected by the BRACELET runtime, primarily for soundness
debugging during development.
The runtime emits two kinds of artifact:
- Trace sites: a
BraceletTraceSitetable embedded in the binary that maps trace-site addresses to(function_symbol, local_idx)pairs — i.e., theedges::Nodefor the value being traced. - Trace edges: pairs
(trace_site, observed_value)written to per-thread files in a traces directory.observed_valuemay be either another trace site (a tracked local) or any other address, which is resolved to a symbol via lldb.
For each (trace_site, value) pair observed at runtime, the checker
constructs the corresponding (Node, Node) edge and verifies that it is
present in the static PointsToEdges set. Any edge witnessed dynamically but
absent from the static result is unsoundness in the pipeline (lost edge
during emission, missing override, SVF approximation gap, …) and is
reported with full source-level names; the run terminates with an error
listing the missing edges and the total count of trace edges checked.
This mode is enabled by passing --trace-dir <dir> together with --core;
it forces save_pts so that the points-to relation is materialized for
comparison.
Command-line interface
The points-to binary is normally driven by the analysis entrypoint script
(see the Example 1 walkthrough), but can be invoked directly:
points-to <executable>
    [--svf-dir <path>]      # SVF install directory; default /opt/svf
    [--clang-dir <path>]    # SVF's clang install; default $SVF_DIR/llvm-16.0.0.obj
    [--llvm-dir <path>]     # SVF's llvm-link install; default $SVF_DIR/llvm-16.0.0.obj
    [--sysroot <path>]      # required with --core: search root for shared libraries
    [--core <coredump>]     # operate on a coredump rather than the linked binary
    [--trace-dir <path>]    # validate static results against runtime traces (requires --core)
    [--tmp <path>]          # use this directory for emission and SVF outputs (kept across runs)
    [--conservative]        # synthesize bodies for declared-but-undefined functions
    [--save-pts]            # emit pts.csv in addition to cg.csv
If --tmp is omitted, a fresh temporary directory is created and removed at
exit. --trace-dir implies --save-pts.
Status and known limitations
- The analysis is field-insensitive and context-insensitive: the emitted C
collapses every pointer to
void *and runs Andersen-style inclusion. This is sufficient for the current reachability use-case but loses precision on programs whose pointer behaviour is dominated by per-field flow. - SVF does not always terminate in reasonable time on large targets (Example 1 is one such case; see the walkthrough). Adding field/context sensitivity and improving scalability remain open work items.
- Weak-symbol metadata is “last writer wins” (see metadata); this carries through to points-to, where the emitted body for a weakly-bound function is whichever definition’s metadata was loaded last.
Vulnerability JSON Format
As described in the Overview, BRACELET requires a small JSON blob describing the vulnerabilities (i.e., CVEs) that the user wishes to analyze. The following example is taken from Example 1:
{
  "vulnerabilities": [
    {
        "cve-id": "CVE-2022-37434",
        "cve-description": "inflate.c via a large gzip header extra field",
        "package-name": "zlib",
        "package-version": "<=1.2.12",
        "cwe-id": "122",
        "cwe-name": "Heap-based Buffer Overflow",
        "affected-function": "inflateGetHeader",
        "affected-file": "inflate.c"
    }
  ]
}
Building the Docker Image
The nix scripts provide a docker image based on Ubuntu 24.04 with the toolchain already installed. This image is intended to be used as a base image for CI builders that use the BRACELET toolchain.
Fetching the Ubuntu Layer
To build using an Ubuntu base layer in nix you first have to fetch the Docker image into the nix store.
The nix-prefetch-docker tool can be used to do this.
Run nix run nixpkgs#nix-prefetch-docker -- --image-name ubuntu --image-tag 24.04 --image-digest sha256:d1e2e92c075e5ca139d51a140fff46f84315c0fdce203eab2807c7e495eff4f9
to fetch the current image used in default.nix. If you would like to update the base image you can remove the image-digest and update the default.nix with the imageDigest and hash produced by the command.
Clear the Rules Cache
Unfortunately, uv2nix etc will setup a workspace that copies everything in the python source directory to the nix store. This can result in copying cached compiled rules
to the nix store if you have used bracelet_scripts locally. These compiled binaries will reference your local nix-cache and fail to run if a user analyzes the same project
you did locally. To avoid this run: rm -r src/bracelet_scripts/rules/*
Build the Image
Now you can build the image with: nix-build -A docker-image
Loading the Image
To save on disk space the nix script builds the image as a streamed image so the result from nix is a script that streams the image to stdout.
So you can load the image by ./result | docker load
You can now re-tag bracelet-toolchain as some other tag to push it to the repository.
Developer documentation
Build
Building our LLVM requires:
apt-get install swig python3-dev lld ninja ccache
Then, to build:
# NOTE: you need to point LLVM_CONFIG at the llvm-config binary from the install
# LLVM prefix (not the raw build directory)
env LLVM_CONFIG=<path to your llvm-config binary> uv run --dev meson setup build --prefix=<your install prefix>
uv run --dev ninja -C build
uv run --dev ninja -C build install # if you want to install to your prefix (optional)
The pass can also be built with upstream LLVM for CI checks; see Building With Upstream LLVM.
If you want to build an optimized version of our tools, pass
--buildtype=debugoptimized to the meson setup command described above.
build/bracelet-cc.sh or <prefix>/bin/bracelet-cc.sh is the clang wrapper script
Tests
To run tests:
uv run --dev pytest src/
uv run --dev ninja -C build test
Table of contents
src/Edges: code for reading and writing graph data to/from binaries and coredumpsrc/bracelet_scripts: Our python code for reachabilitysrc/bracelet_scripts/entrypoint.py: The script that gets invoked in CI for our analysis jobsrc/bracelet_scripts/bracelet_reachability: The original version of our points-to analysis (using soufflé).src/bracelet_scripts/bracelet_reachability/apply_overrides.py: Apply the overrides in overrides.c to an existing graphsrc/bracelet_scripts/bracelet_reachability/cg_lib.py: A library to operate on callgraph edgessrc/bracelet_scripts/bracelet_reachability/gen_rules.py: Generate the datalog rules for our full/slow points-to analysissrc/bracelet_scripts/bracelet_reachability/gen_rules_simple.py: Generate the datalog rules for our super simple points-to analysissrc/bracelet_scripts/points_to: V2 of our points-to code. This is the first version that emits C code for SVF to processsrc/bracelet_scripts/tracing.py: Library to parse trace data from pythonsrc/bracelet-edges:bracelet-edgestool to emit CSV data for our graph edges (consumed by our python scripts)src/BraceletReachability: Our LLVM pass to embed edges into an LLVM modulesrc/BraceletReachability/dlsym_runtime.c: Code that’s used to support our tracking/instrumentation of dlsym()src/BraceletReachability/test_dlsym: Tests for our dlsym instrumentation. Because this is only testing the LLVM pass, this python code is equally applicable to the C++ (V3) points-to. (That is, because it checks that the BraceletReachability pass+runtime work properly, its tests are independent of which points-to code consumes the edges.)src/BraceletReachability/test_tracing: Tests for our indirect callee-only tracing instrumentation. Because this is only testing the LLVM pass, this python code is equally applicable to the C++ (V3) points-to. (That is, because it checks that the BraceletReachability pass+runtime work properly, its tests are independent of which points-to code consumes the edges.)src/ObjectParsing: Parse section data out of coredumps and executablessrc/PointsTo: Our V3 points-to analysis. This parses edge data out of core dumps and emits C code for SVF to process. Unlike the V2 points-to analysis, this approach is much faster and also supports comparing full trace data against SVF’s output.src/Result: A unified Rust-styleResulttypesrc/RuntimeFormat: Specifies data structures and functions that are shared between writers at compile time, runtime libraries at runtime, and readers at analysis/post-coredump timesrc/Subprocess: A utility library to launch subprocessessrc/tempfile: A utility library to create temporary directoriessrc/Tracing: Our tracing runtime to support tracing in our LLVM pass
Profiling
The profile directory contains scripts for comparing compile time between
clang, bracelet-clang, and bracelet-clang with metadata enabled. The README
describes how to use those scripts.
The meson option profile can be set to to true (e.g. uv run --dev meson setup profile-build --prefix=$(pwd)/prefix-profile --buildtype=debugoptimized -Dprofile=true) to launch bracelet-cc and bracelet-cxx with callgrind. This
build can be used with the scripts in profiling to get profiling data sufficient
for analysis in qcachegrind.
Note: This information is call counts and not timing information so can be biased.
Linting
black
We format Python code with black.
uv run --dev black src
isort
We format Python code with isort.
uv run --dev isort src
ruff
We lint Python code with ruff.
uv run --dev ruff check src
ruff has a “fix” mode:
uv run --dev ruff check --fix src
mypy
We type-check Python code with mypy.
uv run --dev mypy src
typos
We spell-check Markdown with typos:
find . -type f -name '*.md' -print | typos --file-list -